Peierls Transition
A Peierls transition or Peierls distortion is a distortion of the periodic lattice of a one-dimensional crystal. Atomic positions oscillate, so that the perfect order of the 1D crystal is broken. 1 Rudolf Peierls discovered it in the 1930’s when writing a section on one-dimensional models in an introductory solid-state textbook. He put it in the book, but didn’t publish it otherwise.
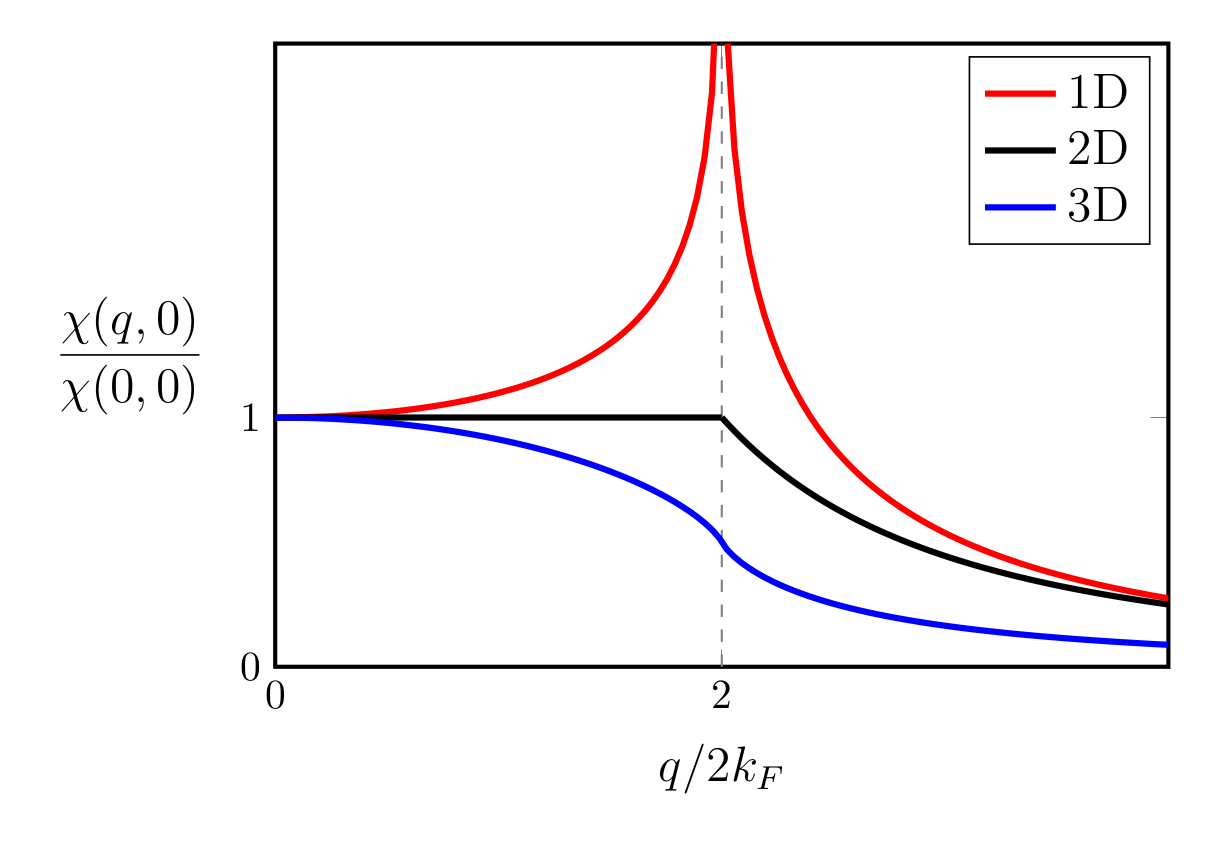
Peierls transition is often used to explain charge density wave (CDW) based on the concept of Fermi surface nesting (FSN), although not all CDW originated from it.2 FSN means that there exist two parallel pieces of a Fermi surface, such that a single $\mathbf{q}$ vector can connect many points. To define FSN, one must calculate the Lindhard susceptibility function $\chi_0(q, \omega=0)$. A ‘real nesting’ requires peaks at $\mathbf{q}_{\text{CDW}}$ in both the imaginary and real parts of the Lindhard function.
In Peierls’ picture, lattice distortion is a secondary effect that arises in response to an electronically driven charge redistribution that would occur regardless of whether or not the ions subsequently shift from their high symmetry positions. In real materials, the electronic and ionic instabilities always occur simultaneously.3
Peierls Transition within Tight-binding Model
-
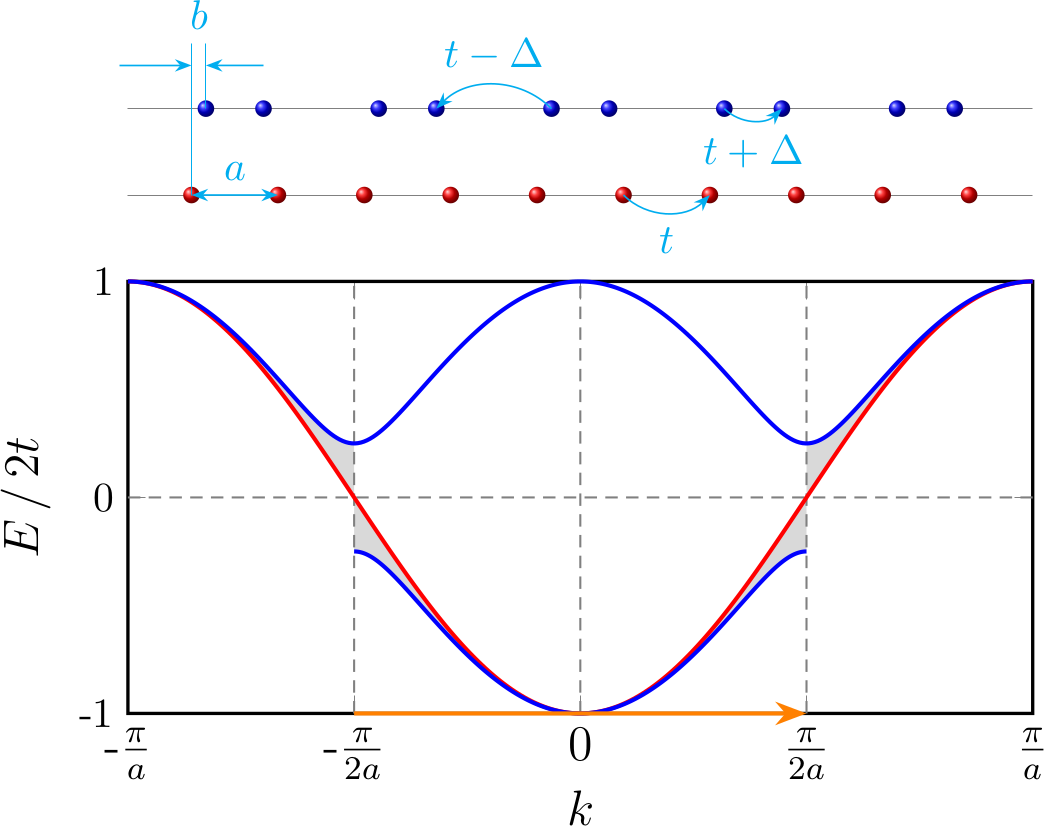
For a 1D equally spaced chain with lattice constant $a$ and hopping integral between adjacent sites $t$ ($t > 0$), tight-binding model gives the band dispersion (red solid in Figure 2)
\[\begin{equation*} \varepsilon_1(k) = -t[e^{ika} + e^{-ika}] = -2t \cos(ka) \end{equation*}\]If there is one electron in each cell, the band is half-filled and the Fermi surface locates at $k_F = \frac{\pi}{2a}$.
-
After the dimerization, suppose the atoms at the even (odd) number site move to the right (left) by distance $b$, i.e. the distance between neighbouring sites become $a - 2b$ and $a + 2b$, as is shown in Figure 2. The hopping terms $t’$ depends on the distance between neighbouring sites
\[\begin{equation*} t'(a \pm 2b) \approx t \pm 2b * \frac{\mathrm{d}t}{\mathrm{d}a} = t \pm b * q_0 = t \mp \Delta \end{equation*}\]The tight-binding model gives
\[\begin{gathered} \begin{align*} H_2 &= \begin{bmatrix} \begin{array}{c c} 0& (t + \Delta) + (t - \Delta)\cdot e^{-i2ka} \\[6pt] (t + \Delta) + (t - \Delta)\cdot e^{i2ka} & 0 \\ \end{array} \end{bmatrix} \\[12pt] &= \begin{bmatrix} \begin{array}{c c} 0& 2e^{-ika} \left[t \cos(ka) + i\Delta\sin(ka)\right] \\[6pt] 2e^{ika} \left[t \cos(ka) - i\Delta\sin(ka)\right] & 0 \\ \end{array} \end{bmatrix} \end{align*} \\[12pt] \Rightarrow\quad \varepsilon_2(k) = \pm2\sqrt{t^2\cos^2(ka) + \Delta^2\sin^2(ka)} \end{gathered}\]There is a band gap $E_g = 4\Delta$ at $k = \pi / 2a$.
-
Under the harmonic approximation, the phonon dispersion of 1D atomic chain is given by
\[\begin{equation*} \omega = \sqrt{\frac{4K}{M}} | \sin \frac{qa}{2} | \end{equation*}\]where $K$ is the spring contant. The dimerization corresponds the phonon mode at $q=\frac{\pi}{a}$, therefore the energy loss from the lattice distortion is given by
\[\begin{align*} \Delta E_\ell &= N\cdot \frac{1}{2}M\omega^2_{q=\frac{\pi}{a}} b^2 \\[6pt] &= N \cdot 2Kb^2 \end{align*}\]where $N$ is the number of cells.
-
The energy gain due to the gap openning is given by
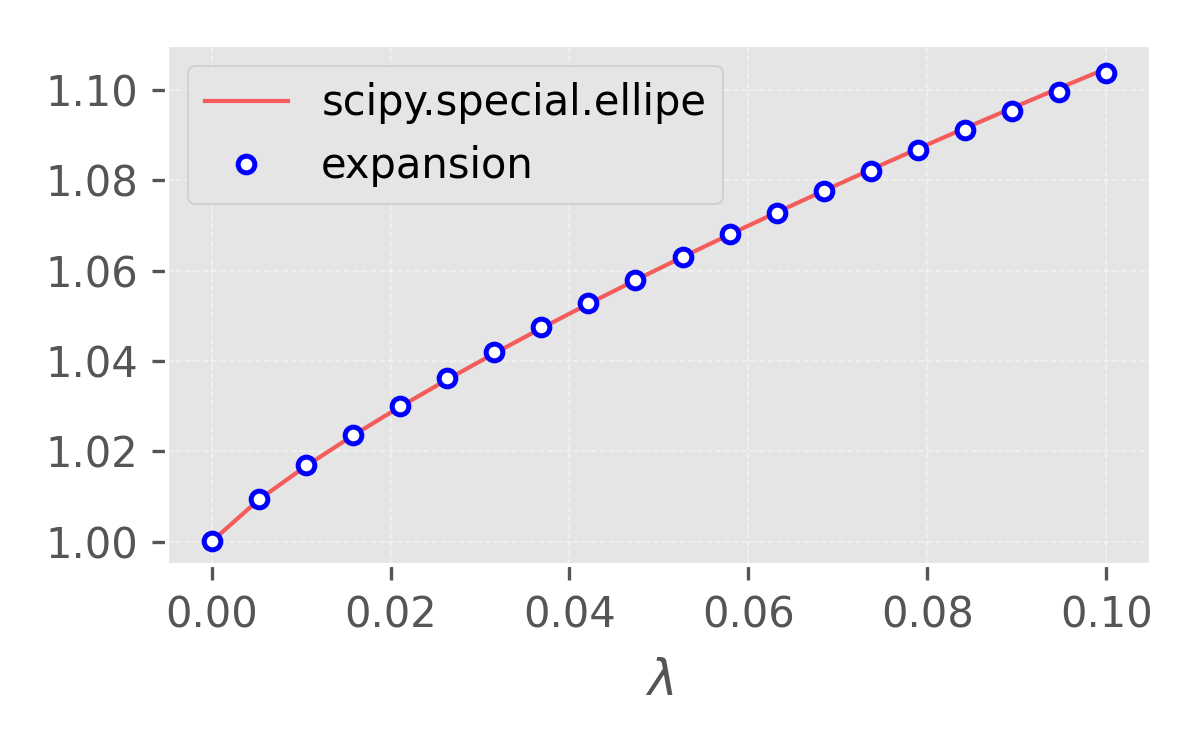
\[\begin{aligned} \Delta E_e &= \frac{Na}{2\pi}\int_{-\pi/2a}^{\pi/2a} [\varepsilon_2(k) - \varepsilon_1(k)] \, \mathrm{d}k \\[3pt] &= -2t\frac{Na}{2\pi}\int_{-\pi/2a}^{\pi/2a} \left[\sqrt{\cos^2(ka) + \frac{\Delta^2}{t^2}\sin^2(ka)} - \cos(ka)\right] \, \mathrm{d}k \\[3pt] &= -2t\frac{N}{\pi}\int_{0}^{\pi/2} \left[\sqrt{\cos^2(\theta) + \frac{\Delta^2}{t^2}\sin^2(\theta)} - \cos(\theta)\right] \, \mathrm{d}\theta \\[3pt] &= -2t\frac{N}{\pi}\int_{0}^{\pi/2} \left[\sqrt{\cos^2(\theta) + \frac{\Delta^2}{t^2}\sin^2(\theta)} - \cos(\theta)\right] \, \mathrm{d}\theta \\[3pt] &= -2t\frac{N}{\pi} \left[\int_{0}^{\pi/2} \sqrt{1 - (1-\lambda)\sin^2(\theta)} \, \mathrm{d}\theta - 1 \right]\\[3pt] \end{aligned}\]where $\lambda = \Delta^2/t^2 = q_0^2 b^2 / t^2$. The integral in the above equation is an elliptic integral $E(1-\lambda)$ 45. For sufficiently small $\lambda$, the elliptic integral can be expanded as 6
\[\begin{equation*} E(1-\lambda) = 1 + \lambda[a_1 - \frac{1}{4}\ln(\lambda)] + {\cal O}(\lambda^2),\quad a_1 = 0.463 \end{equation*}\]
Figure 3. One can show that the expansion and the exact value from scipy are very close for small $\lambda$. Figure generated by matplotlib. -
The total energy is then given by
\[\begin{align*} \Delta E_t &= \Delta E_\ell + \Delta E_e \\[3pt] &= N\lambda [\alpha + \beta\ln\lambda] \end{align*}\]where
\[\begin{equation*} \alpha = \frac{2Kt^2}{q_0^2} - \frac{2a_1t}{\pi}, \qquad \beta = \frac{t}{2\pi} \end{equation*}\]The minimum erergy can be found from $\displaystyle\frac{\mathrm{d}\Delta E_t}{\mathrm{d}\lambda} = 0$, which gives
\[\begin{align*} \ln\lambda &= - \frac{\alpha + \beta}{\beta} \\ \Delta E_t &= -N\beta\exp\left(-\frac{ \alpha + \beta }{\beta}\right) \end{align*}\]The dimerized chain has lower energy regardless of the values of $\alpha$ and $\beta$, as long as $\beta$ is positive.
References
-
Misconceptions associated with the origin of charge density waves ↩
-
Fermi surface nesting and the origin of charge density waves in metals ↩
-
I actually DO NOT know how to get the expansion. ↩