Visible light spectrum
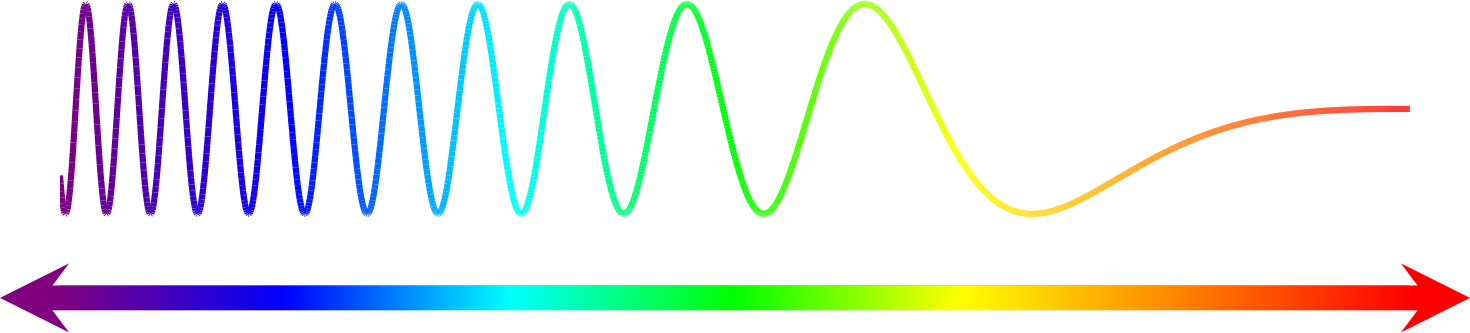
In this post, I will try to use TikZ to plot schematics of visible light spectrum. First, we must find out the proper function that represents the varying wavelength of the electromagnetic wave. There are many options, one of them be like
\[\sin (\alpha t^3)\]In addition, I would like to change the color at different positions of the wave. As far as I know, there are two options
- Linecollections method in matplotlib
\addplot [mesh, point metal=x] {sin(45*x^3)};in PGFPlots
And finally, add a colorbar-like object at the bottom of the wave, where the
color of the “colorbar” and the wave should match vertically. To do this, one
can either use the \shade command in TikZ.
1
2
3
4
5
6
7
8
9
10
11
12
13
14
15
16
17
18
19
20
21
22
23
24
25
26
27
28
29
30
31
32
33
34
35
36
37
38
39
40
41
42
43
44
45
46
47
48
49
50
51
52
53
54
55
56
57
58
59
60
61
62
63
64
65
66
67
68
69
70
71
72
73
74
75
76
77
78
79
80
81
82
83
84
85
86
87
88
89
90
91
92
93
94
95
96
97
98
99
\documentclass[border=10pt]{standalone}
\usepackage{tikz}
\usetikzlibrary{
  calc
}
\usepackage{pgfplots}

% https://tex.stackexchange.com/questions/218569/define-stretchable-shading
\newbox\shbox
\tikzset{
  path picture shading/.style={
    path picture={
        \pgfpointdiff{\pgfpointanchor{path picture bounding box}{south west}}
        {\pgfpointanchor{path picture bounding box}{north east}}
        \pgfgetlastxy\pathwidth\pathheight
        \pgfinterruptpicture
        \global\setbox\shbox=\hbox{\pgfuseshading{#1}}
        \endpgfinterruptpicture
        \pgftransformshift{\pgfpointanchor{path picture bounding box}{center}}
        \pgftransformxscale{\pathwidth/(\wd\shbox)}
        \pgftransformyscale{\pathheight/(\ht\shbox)}% \dp will (should) be 0pt
        \pgftext{\box\shbox}
    }
  }
}
\pgfdeclarehorizontalshading{spectrum}{50bp}{
    color(0.00000000000000bp)=(violet);
    color(8.33333333333333bp)=(blue);
    color(16.66666666666670bp)=(cyan);
    color(25.00000000000000bp)=(green);
    color(33.33333333333330bp)=(yellow);
    color(41.66666666666670bp)=(orange);
    color(50.00000000000000bp)=(red)
}
% \definecolor{myleftcolor}{rgb}{0.5020, 0, 0}
% \definecolor{myrightcolor}{rgb}{0, 0, 0.7059}

\pgfplotsset{
  colormap={spectrum}{
    color(0.00000000000000bp)=(violet);
    color(8.33333333333333bp)=(blue);
    color(16.66666666666670bp)=(cyan);
    color(25.00000000000000bp)=(green);
    color(33.33333333333330bp)=(yellow);
    color(41.66666666666670bp)=(orange);
    color(50.00000000000000bp)=(red)
  }
}
\begin{document}


\begin{tikzpicture}
  % define the unit
  [x=1in, y=0.35in]
  \shade[
    path picture shading=spectrum
  ] (0, -3pt) rectangle (4.5, 3pt);
  \draw[
    ->, >=stealth,
    line width=6pt, anchor=east, color=violet
  ] (0, 0) -- ++(-0.2, 0);
  \draw[
  ->, >=stealth,
  line width=6pt, anchor=west, color=red
  ] (4.5, 0) -- ++(0.2, 0);

  \begin{axis}
    [
      % tell pgfplot to use the same unit as tikz
      x=1in, y=0.35in,
      % the size of pgfplot
      % width=5in, height=1in,
      % set the domain of the function
      domain=-4.5:0,
      % only show the domain
      xmin=-4.5, xmax=0,
      ymin=-1.8,
      % do not show the spines of the axes
      axis lines=none,
      % define the colormap, bluered inverted
      colormap name=spectrum,
      % colormap={reverse bluered}{
      %   indices of colormap={
      %       \pgfplotscolormaplastindexof{bluered},...,0 of bluered}
      % },
    ]
    \addplot[
      mesh, point meta=x,
      % number of points
      samples=2000,
      line width=1.5pt,
    ] {
      % the function of the spectrum
      sin(45*x^3)
    };
  \end{axis}
\end{tikzpicture}

\end{document}
Or one can use the colorbar in PGFPlots and add arrows to both ends of it.
1
2
3
4
5
6
7
8
9
10
11
12
13
14
15
16
17
18
19
20
21
22
23
24
25
26
27
28
29
30
31
32
33
34
35
36
37
38
39
40
41
42
43
44
45
46
47
48
49
50
51
52
53
54
55
56
57
58
59
60
61
62
63
64
65
66
67
68
69
70
71
72
73
74
75
\documentclass[border=10pt]{standalone}
\usepackage{tikz}
\usetikzlibrary{
  calc
}
\usepackage{pgfplots}

\pgfplotsset{
  colormap={spectrum}{
    color(0.00000000000000bp)=(violet);
    color(8.33333333333333bp)=(blue);
    color(16.66666666666670bp)=(cyan);
    color(25.00000000000000bp)=(green);
    color(33.33333333333330bp)=(yellow);
    color(41.66666666666670bp)=(orange);
    color(50.00000000000000bp)=(red)
  }
}
\begin{document}


\begin{tikzpicture}
  % define the unit
  [x=1in, y=0.35in]

  \begin{axis}
    [
      % tell pgfplot to use the same unit as tikz
      x=1in, y=0.35in,
      % the size of pgfplot
      % width=5in, height=1in,
      % set the domain of the function
      domain=-4.5:0,
      % only show the domain
      xmin=-4.5, xmax=0,
      % ymin=-1.8,
      % do not show the spines of the axes
      axis lines=none,
      % define the colormap, bluered inverted
      colormap name=spectrum,
      % if you use 'rel axis cs', add this to show contents out of the axis
      clip=false,
      % colorbar settings
      colorbar horizontal,
      colorbar style = {
        at = {(0, -0.20)},
        height=6pt,
        anchor=west,
        axis lines=none,
        % ticks=none,
      }
    ]
    \addplot[
      mesh, point meta=x,
      % number of points
      samples=2000,
      line width=1.5pt,
    ] {
      % the function of the spectrum
      sin(45*x^3)
    };

    % add arrows to both ends of the colorbar
    \draw[
      ->, >=stealth,
      line width=6pt, anchor=east, color=violet
    ] (rel axis cs: 0, -0.20) -- (rel axis cs: -0.05, -0.20);
    \draw[
    ->, >=stealth,
    line width=6pt, anchor=west, color=red
    ] (rel axis cs: 1, -0.20) -- (rel axis cs: 1.05, -0.20);
  \end{axis}
\end{tikzpicture}

\end{document}
The final results be like.