Apr 29, 2021
2021-04-29T22:30:00+08:00
by
Qijing Zheng
Updated
Nov 5, 2022
2022-11-05T00:30:14+08:004 min
Introduction
In mathematics and physical science, spherical harmonics are special functions
defined on the surface of a sphere. The spherical harmonics form a complete set
of orthogonal functions and thus an orthonormal basis, each function defined on
the surface of a sphere can be written as a sum of these spherical harmonics.
Table of spherical harmonics
A more comploete list of spherical harmonics can be found
here.
\[\begin{equation*}
Y_l^m =
\begin{cases}
{1\over\sqrt{2}} (Y_{l|m|} - i Y_{l,-|m|}), & \quad\text{if } m < 0 \\[6pt]
Y_{l0}, & \quad\text{if } m = 0 \\[6pt]
{(-1)^m\over\sqrt{2}} (Y_{lm} + iY_{l,-m}), & \quad\text{if } m > 0
\end{cases}
\end{equation*}\]
Spherical harmonics visualization
The complex spherical harmonics can be computed by scipy.special.sph_harm. I
also wrote a small helping
script
to convert from the complex spherical harmonics to real ones. For example, with
my little script
1
2
3
4
fromsph_harmimportshow_sph_harm# available plotting methods are 'mpl', 'mayavi' and 'plotly'
show_sph_harm(l=2,m=1,real=True,plot='mpl')
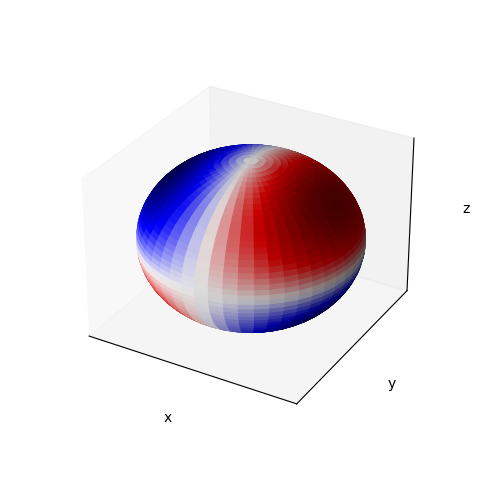
shows the real spherical harmonics $Y_{lm}(\theta, \phi)$ with $l=2, m=1$ on a
sphere, the resulting figure
Figure.
Visual representations of the real spherical harmonics on a sphere with
radius 1.0.
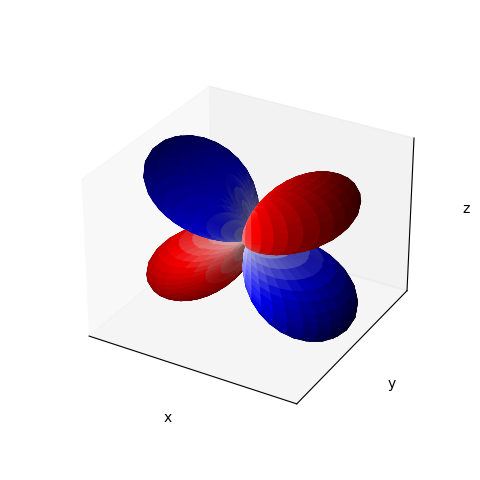
Or we can use another method to better visualize the nodes.
1
2
3
4
fromsph_harmimportshow_sph_harm# available plotting methods are 'mpl', 'mayavi' and 'plotly'
show_sph_harm(l=2,m=1,real=True,use_sphere=False,plot='mpl')
Figure.
Visual representations of the real spherical harmonics. The distance of
the surface from the origin indicate the absolute value of
$Y_{lm}(\theta, \phi)$ in angular direction $(\theta, \phi)$, i.e.
$|Y_{lm}(\theta, \phi)|$. The color represents the value of
$Y_{lm}(\theta, \phi)$.
Below, I used Plotly
to list the real spherical harmonics up to $l = 3$