
Problem
Suppose we have a periodic function $f(x,y)$ defined within a hexagonal unit cell, how can we plot the function on the Wigner-Seitz cell?
Codes
1
2
3
4
5
6
7
8
9
10
11
12
13
14
15
16
17
18
19
20
21
22
23
24
25
26
27
28
29
30
31
32
33
34
35
36
37
38
39
40
41
42
43
44
45
46
47
48
49
50
51
52
53
54
55
56
57
58
59
60
61
62
63
64
65
66
67
68
69
70
#!/usr/bin/env python
# -*- coding: utf-8 -*-

import numpy as np
import matplotlib.pyplot as plt
from mpl_toolkits.axes_grid1 import make_axes_locatable
from matplotlib.patches import Polygon

# lattice constant of th 2D honeycomb cell
L = 1.0
# number of grid points in each direction
nx, ny = 100, 100
# The 2D cell basis vector
cell = L * np.array([[1.0, 0.0], [-0.5, np.sqrt(3) / 2.]])

# the fractional coordinates of the grid points
x0, y0 = np.mgrid[0:1:1j*nx, 0:1:1j*ny]
# the Cartesian coordinates of the grid points
x1, y1 = np.tensordot(cell, [x0, y0], axes=(0, 0))

# any periodic functions
w = 2
z = np.sin(w * 2 * np.pi / L * x0) + np.sin(w * 2 * np.pi / L * y0)

fig = plt.figure(
    figsize=(4.0, 2.0),
    dpi=300
)
axes = [plt.subplot(121), plt.subplot(122)]

############################################################
ax = axes[0]
ax.pcolormesh(x1, y1, z, shading='auto')

cc = L * np.exp(1j * np.pi / 3 * np.arange(7))
hh = Polygon(np.c_[cc.real, cc.imag],
             lw=0.5, edgecolor='b',
             clip_on=False, facecolor='none')
ax.add_patch(hh)

cc = L * np.sqrt(3) / 3 * np.exp(1j * np.pi * (1./6 + 1./3 * np.arange(7)))
hh = Polygon(np.c_[cc.real, cc.imag],
             lw=0.5, edgecolor='r',
             clip_on=False, facecolor='none')
ax.add_patch(hh)
############################################################
ax = axes[1]

cc = L * np.sqrt(3) / 3 * np.exp(1j * np.pi * (1./6 + 1./3 * np.arange(7)))
hh = Polygon(np.c_[cc.real, cc.imag],
             lw=0.0, edgecolor='k',
             clip_on=False, facecolor='none')
ax.add_patch(hh)

for ii in range(-1, 1):
    for jj in range(-1, 1):
        x2, y2 = np.tensordot(cell, [x0 + ii, y0 + jj], axes=(0, 0))
        img = ax.pcolormesh(x2, y2, z, shading='auto')
        img.set_clip_path(hh)

for ax in axes:
    ax.set_aspect(1.0)
    ax.set_xlim(-L, L)
    ax.set_ylim(-L, L)
    ax.set_xticks([])
    ax.set_yticks([])

plt.tight_layout()
plt.savefig('kaka.png')
# plt.show()
The results
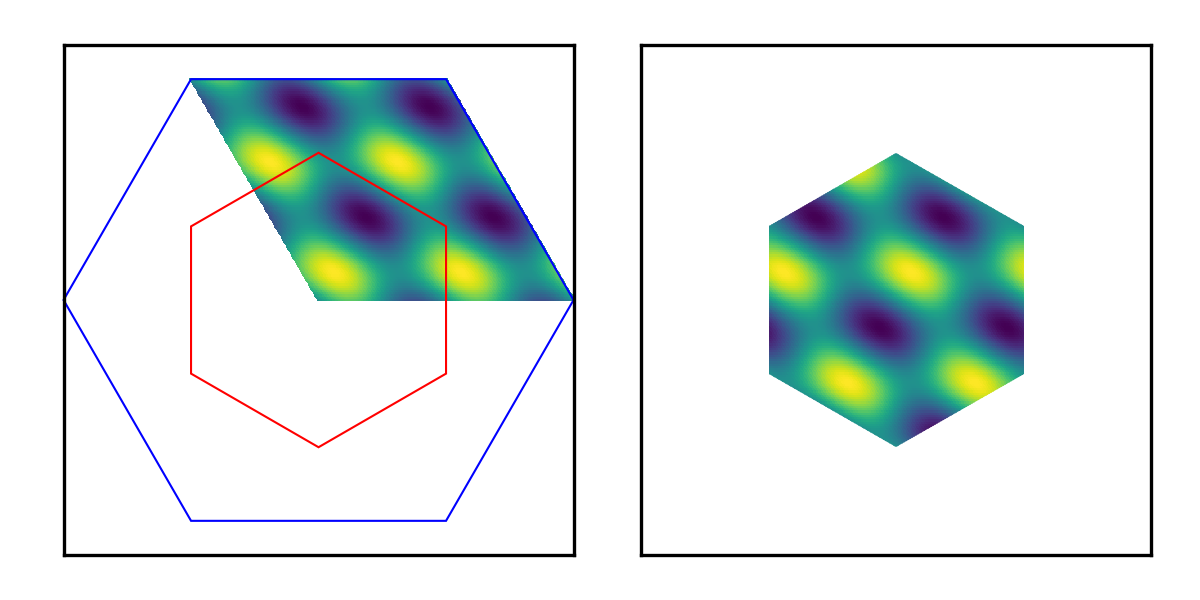
Right panel: The same periodic function on the Wigner-Seitz cell.